Attēls:European Output of Books 500–1800.png

Lapas saturs netiek atbalstīts citās valodās.
No ''Wiktionary''

Sākotnējais fails(1 436 × 953 pikseļi, faila izmērs: 64 KB, MIME tips: image/png)

Fails ir no Wikimedia Commons, tāpēc tas var tikt izmantots citos projektos. Apraksts ir faila apraksta lapā, kas ir parādīta zemāk.

Kopsavilkums

Apraksts
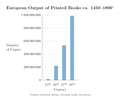
Deutsch: Geschätzte europäische Buchproduktion von 500 bis 1800. Bei den Manuskripten sind einzelne Urkunden und Chartas nicht berücksichtigt. Ein gedrucktes Buch ist definiert als ein Druckwerk von mehr als 49 Seiten.
English: Estimated European output of books from 500 to 1800. Manuscripts do not include individual deeds and charters. A printed book is defined as printed matter containing more than 49 pages.
Datums
Avots

Paša darbs

Data from: Buringh, Eltjo; van Zanden, Jan Luiten: "Charting the “Rise of the West”: Manuscripts and Printed Books in Europe, A Long-Term Perspective from the Sixth through Eighteenth Centuries", The Journal of Economic History, Vol. 69, No. 2 (2009), pp. 409–445 (416–417, tables 1&2)
Autors Tentotwo
Citas versijas
This graph image could be re-created using vector graphics as an SVG file. This has several advantages; see Commons:Media for cleanup for more information. If an SVG form of this image is available, please upload it and afterwards replace this template with {{vector version available|new image name}}.


It is recommended to name the SVG file “European Output of Books 500–1800.svg”—then the template Vector version available (or Vva) does not need the new image name parameter.

LaTeX source

\documentclass[border=5mm]{standalone}
\usepackage{pgfplots}
\usepackage[super]{nth}
\usepackage{amsmath}
 
 
\pgfplotstableread{
Siglos Manuscritos Libros impresos
6       13552           nan
7       10639           nan
8       43702           nan
9       201742  nan
10      135637  nan
11      212030  nan
12      768721  nan
13      1761951 nan
14      2746951 nan
%15   4999161 12589000
16       nan            217444000
17      nan             531941000
18      nan             983874000
}\datatable
 
\definecolor{RYB1}{RGB}{128, 177, 211}
\definecolor{RYB2}{RGB}{253, 180, 98}
 
\begin{document}
\begin{tikzpicture}
\begin{semilogyaxis}[
        axis on top=false, grid=both, xmajorgrids=false, every minor grid/.style=gray!20,
        axis lines*=left,
        width=12cm, height=8cm, enlarge x limits=0.05,
        ymin=1000, ymax=1e9,ytick={1000,1e4, 1e5, 1e6, 1e7, 1e8, 1e9},
        yticklabels={1000, 10\,000, 100\,000, 1\,000\,000, 10\,000\,000, 100\,000\,000, 1\,000\,000\,000},
        enlarge y limits=false,
        ybar=-10pt, xtick={6,...,18}, xticklabel={\pgfmathparse{int(\tick)}\nth{\pgfmathresult}},
        xlabel=Siglos, xlabel style={yshift=-1ex},ylabel=Número\\ de Copias,
        ylabel style={rotate=-90, align=left, anchor=east, xshift=-4ex, name=ylabel},
        after end axis/.code={
                \node [
                        font=\large\bfseries,
                        text=RYB2!60!black, fill=white, fill opacity=0.85, text opacity=1,
                        anchor=center, inner xsep=1pt]  at (axis cs:11,5e3) {Manuscritos};
                \node [
                        font=\large\bfseries, inner xsep=1pt,
                        text=RYB1!60!black,
                        fill=white, fill opacity=0.85, text opacity=1,
                        align=center, anchor=center]  at (axis cs:16.6,5e3) {Libros impresos};\
        },
        title={Producción Europea occidental de libros entre los años 500 y 1800$^{\text{\tiny{*}}}$},
        title style={font=\large\bfseries, align=center}
        ]
 
        \addplot +[fill=RYB1, draw=RYB1!50!black] table [y=Books] {\datatable};
        \addplot +[fill=RYB1, draw=RYB1!50!black, /pgf/bar shift=2.5pt] coordinates {(15,12589000)};
        \addplot +[fill=RYB2, draw=RYB2!50!black] table {\datatable};
        \addplot +[fill=RYB2, draw=RYB2!50!black, /pgf/bar shift=-2.5pt] coordinates {(15,4999161)};
        \draw (rel axis cs:0,0) -- (rel axis cs:1,0);                 
\end{semilogyaxis}
\node (annotation) at (current axis.below south west) [inner xsep=0pt, anchor=north west, align=left, font=\tiny] {$^*$without Southeast Europe (Byzantine, later Ottoman realm) and Russia};
 
\end{tikzpicture}
\end{document}

Licence

Es, šī darba autortiesību īpašnieks, publicēju to saskaņā ar šo licenci:
w:en:Creative Commons
atsaucoties nemainot licenci
Šis fails tiek izplatīts saskaņā ar licences Creative Commons Atsauce-Līdzīgi Noteikumi 3.0 Vispārējiem noteikumiem.
Jūs varat brīvi:
  • koplietot – kopēt, izplatīt un pārraidīt darbu
  • remiksēt – pielāgot darbu
Saskaņā ar šādiem nosacījumiem:
  • atsaucoties – Tev ir jānorāda autors, saite uz licenci un to, vai veiktas kādas izmaiņas. To var darīt jebkādā saprātīgā veidā, bet ne tādā, kas norādītu, ka licencētājs atbalsta tevi vai veidu, kā tu izmanto šo darbu.
  • nemainot licenci – Ja tu miksē, pārveido vai izmanto materiālu, tev savs devums jāpublicē ar to pašu vai saderīgu licenci kā oriģināls.

Captions

Pievieno vienas rindiņas aprakstu, ko šis fails attēlo

Šajā failā attēlotais

attēlo

15 decembris 2011

Faila hronoloģija

Uzklikšķini uz datums/laiks kolonnā esošās saites, lai apskatītos, kā šis fails izskatījās tad.

Datums/LaiksAttēlsIzmēriDalībnieksKomentārs
tagadējais2011. gada 22. decembris, plkst. 02.412011. gada 22. decembris, plkst. 02.41 versijas sīktēls1 436 × 953 (64 KB)TentotwoRemoved source text from image
2011. gada 16. decembris, plkst. 03.532011. gada 16. decembris, plkst. 03.53 versijas sīktēls1 455 × 953 (73 KB)TentotwoImproved formatting
2011. gada 15. decembris, plkst. 00.382011. gada 15. decembris, plkst. 00.38 versijas sīktēls1 260 × 799 (87 KB)Tentotwo

Šo failu neizmanto nevienā lapā.

Globālais faila lietojums

Šīs Vikipēdijas izmanto šo failu: